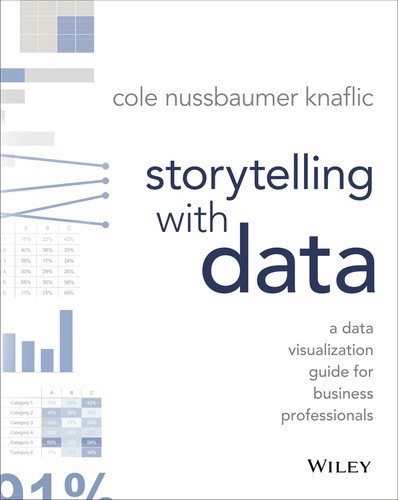
A practical guide to turning cluttered graphs into clear, focused visuals that help an audience understand a point and act on it
Don't just show the data
Most business charts are made with default software settings and too much information. Cole Nussbaumer Knaflic, who taught data visualization to teams at Google, argues that a graph should have a clear purpose and a clear message. Her book walks through how to understand the context, pick the right chart, strip away clutter and guide the viewer's eye to what matters.
Who will enjoy it
Analysts, managers, students and anyone who builds slides or reports with numbers and wants their charts to be understood quickly.
What you will get
A clear and practical guide to designing charts that people actually understand, built on simple principles and dozens of real before-and-after makeovers.
Storytelling with Data Facts: Pages, Genre and Setting
Genre
Nonfiction · Data visualization · Business presentations · Clear charts
Length
288 pages · ≈ 8 h
More about this book
The book is organised around a handful of lessons: understand the context, choose an appropriate display, eliminate clutter, focus attention, think like a designer and tell a story. Each lesson comes with concrete examples, and the best moments are the makeovers, where a messy default chart is rebuilt step by step into something you can read in seconds.
Knaflic writes plainly and avoids theory for its own sake. She is especially good on why pie charts and three-dimensional effects usually hurt, how to use colour sparingly to highlight one thing, and how a strong title can do half the work of a chart. The later chapters on narrative structure help readers plan a whole presentation rather than single graphs.
Experienced designers will find much of it familiar, and the focus is firmly on business charts rather than scientific or interactive graphics. A follow-up workbook offers more exercises for practice. The examples are drawn from real workplace situations, so readers can apply the ideas to their next report the same afternoon, and the clean, uncluttered design of the book itself demonstrates the principles it teaches. About 288 pages in the Wiley paperback.
 The Visual Display of Quantitative Information
 Envisioning Information
 Presentation Zen
 Show Me the Numbers
 How to Lie with Statistics
 Nudge
 Decoding Your Dog
 Jack: Straight from the Gut
 Logo Design Love
 Keys to Good Cooking
 You Just Don't Understand
 Etiquette