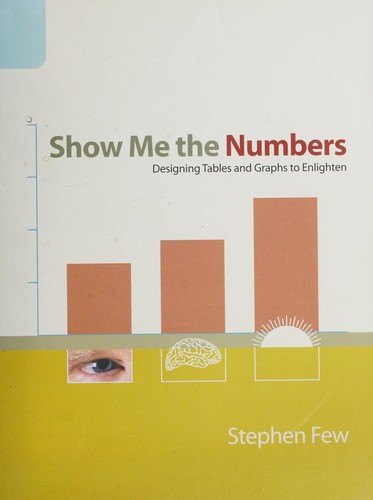
A practical guide to designing tables and graphs that communicate numbers clearly, based on how people actually perceive visual information
Numbers people can read
Stephen Few argues that most business tables and graphs are poorly designed, often to the point of being misleading. He explains, in plain language, how visual perception works and how to use that knowledge to present quantitative information clearly. The book covers when to use a table and when to use a graph, how to choose the right type of graph, how to design each component, and how to remove clutter so the data stands out, with many before-and-after examples.
Who will enjoy it
Analysts, managers and anyone who prepares reports, students of data visualisation, and spreadsheet users who want their charts to communicate better.
What you will get
A practical, perception-based guide to designing tables and graphs that present numbers clearly, with practical rules and many before-and-after examples.
Show Me the Numbers Facts: Pages, Genre and Setting
Genre
Nonfiction · Tables and graphs · Data presentation · Business reporting
Length
280 pages · ≈ 8 h
More about this book
Few writes for people who work with numbers every day, not for designers, and his approach is refreshingly practical. He explains the basics of visual perception and then shows how each principle applies to real business reports. The before-and-after examples, which take cluttered, confusing charts and redesign them, are the book's greatest strength.
The guidance on choosing between tables and graphs, and on matching graph types to the relationships in the data, is especially valuable. Few is also excellent on small design details, such as gridlines, labels and colour, that make a big difference to readability. Few readers will look at their own charts in quite the same way afterwards.
The tone can be stern, and Few has firm opinions, including a strong dislike of pie charts and three-dimensional effects, which some readers find rigid. The examples focus on business reporting rather than journalism or science. A revised second edition expands the material. As a foundation for clear data presentation, it is excellent. It also works well as a team reference, since its clear rules give colleagues a shared vocabulary for discussing and improving the reports they produce together. About 280 pages in the Analytics Press first edition.
 Storytelling with Data
 The Visual Display of Quantitative Information
 Envisioning Information
 Graphic Design: The New Basics
 Steering the Craft
 The Organic Gardener's Handbook of Natural Pest and Disease Control
 The Art of Being
 Man and His Symbols
 The Perfect Loaf
 On Human Nature
 Light on Yoga
 The Elements of Color