Home › Nonfiction › The Visual Display of Quantitative Information
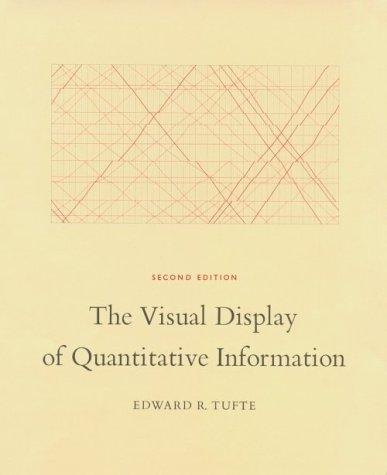
A classic on how to show data clearly in charts and graphics
1983Slow paceThoughtful
What it is about
Edward Tufte sets out principles of graphical excellence, using examples of good and bad charts from the last two centuries. He argues for showing the data clearly and removing needless decoration. The book became a standard reference for designers and analysts.
Who will enjoy it
Readers who work with data and design.
What you will get
It introduced terms such as chartjunk.
The Visual Display of Quantitative Information Facts: Pages, Genre and Setting
Genre
Nonfiction · Data · Design · Charts
Length
197 pages · ≈ 6 h
More about this book
Characters
Edward R. Tufte.
Setting
Charts, maps and timelines.
What makes it different
A design book that is itself beautifully printed.
Feel
Precise, elegant and opinionated.
 Outliers: The Story of Success
 The Goal
 Ways of Seeing
 The Black Swan
 The Autobiography of Malcolm X
 The Selfish Gene
 The God Delusion